Accessibility Checking Software
The next step is actually working with some accessibility testing software. The Web Accessibility Initiative Evaluation and Repair Tools working group has over 90 software tools listed in three categories, Evaluation, Repair and Transformation. We are looking at only six commercial web accessibility testing tools. The tools are listed here with a brief description drawn from each corresponding web site.
- Bobby from Watchfire. $299. Bobby spiders through a website and tests on a page-by-page basis to see if it meets several accessibility requirements, including readability by screen readers, the provision of text equivalents for all images, animated elements, audio and video displays. Bobby can see local web pages, as well as web pages behind your firewall. It performs over 90 accessibility checks.
- InFocus from SSB Technologies. $1795. InFocus™ InFocus Desktop was the first commercial Web accessibility software and remains the market leader,with over 115 accessibility tests encompassing all major accessibility standards and a high level of automation available, InFocus
- The LIFT Machine from UsableNet $999. LIFT Machine is a server-based application that automatically scans internal and external websites for over 140 quality, accessibility, and usability issues. It then generates a variety of web-based reports for both executives and individual content creators.
- Ramp Ascend from Deque $1499.. Ramp Ascend includes full capabilities for adding SMIL captioning to multi-media, ensures web animations are safe, and provides comprehensive table remediation to even the most complex, n-dimensional tables. Includes plug-ins for Macromedia Dreamweaver, Microsoft FrontPage, and Mercury Interactive TestDirector 8. The product without repair functions is Ramp Grade, $269, and without spidering, Ramp Personal Edition, $69. Deque also an Enterprise product.
- WebKing from Parasoft (Contact info@parasoft.com for prices.) WebKing allows users to record critical user click paths by following them in a browser, then it automatically configures and executes functional/regression tests that verify paths and page contents while ignoring insignificant differences. WebKing’s static analysis identifies client-side code that does not comply with Section 508 accessibility rules, and pages with broken links, XML problems, and spelling errors.
- WebXM from Watchfire (Contact sales@watchfire.com for prices.) Watchfire provides software and services to identify, measure and prioritize accessibility, and compliance risks that exist on corporate web properties.
Our exposure to these tools barely scratches the surface. We will be looking at a simple process of evaluating about 70 files, looking for specific errors in about half the cases, and looking to see if (specific) errors are not present in roughly the other half. Ours is not a complicated spidering problem. Once errors are found we are not interested in repair (remediation) provided by both InFocus and Ramp. LIFT offer tests for usability as do both WebKing and WebXM—we aren’t looking at those tests. For the latter two, accessibility is only a recent addition to site maintenance, integrity and security.
When these tests were first run there were two additional tools that are not included here. One was aDesigner, a beta version of a tool from IBM Tokyo Research Center, available from IBM AlphaWorks. I hadn’t remembered that the public version of the tool did not have any spidering so it was not acceptable for our task. The second tool that dropped from the process is PageScreamer because the company (Crunchy Technologies) seems to be out of business. aDesigner had one of the best scores on the first round while PageScreamer had the worst.
The descriptions of the testing tools that follow go through the four simple steps of setting up the tests to be performed, analyzing the files, examining the results, obtaining reports. Generally I tried to use WCAG AA conformance together with the Section 508 standards.
Bobby 5.0 from Watchfire.
Bobby, from Watchfire, http://www.watchfire.com, is the best known accessibility checker because it has been around for the longest time. Bobby was first released by CAST, the Center for Applied Special Technology, http://www.cast.org/, as a free downloadable tool in September, 1996. Bobby was acquired by Watchfire in 2002 where they produced Version 5.0 in 2003 with improved spidering and reporting. My understanding is that the testing algorithms for the previous version, Bobby Worldwide (Version 4.0), are the same.
Choose the tests to be used – Bobby
To choose tests in Bobby 5.0 we need to create a project and associate the choice of tests with that project. So once Bobby is started, open the Project Properties dialog ( Tools | Project Properties ). For now, choose a name for the project, say STEP Tests, and go to Accessibility from the left hand menu of the project Properties dialog shown in Figure 13-1.
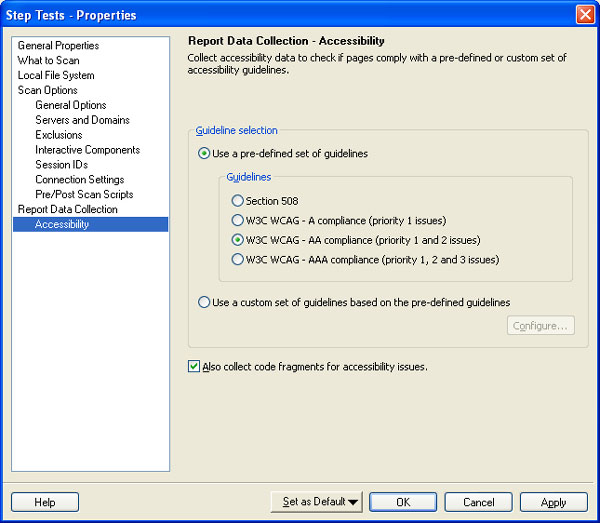
Figure 13-1. Choose guideline sets in Bobby 5.0
The Guideline selection section of this properties dialog allows the choice of Section 508 Standards or the Web Content Accessibility Guidelines, with A, AA, or AAA compliance just like the choices for most of the tools. Also like WebXM, there is no way to say Section 508 and Priority 1 and 2 WCAG. So instead, we will create a custom set of guidelines that combines the two.
Note the checkbox, to collect code. If you want the code fragments included in the reports, you need to check this box.
The Configure Custom Guidelines dialog (using the Configure button from the Properties Dialog) is shown in Figure 13-2.
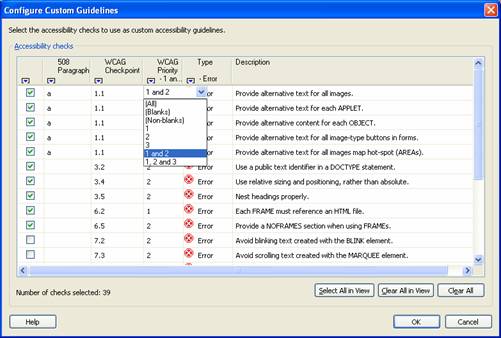
Figure 13-2. Test selection with Bobby
This Bobby interface includes all the relevant information for each test. The Type column indicates whether or not the test raises an error or a warning. For each test, the corresponding WCAG checkpoint and priority is listed. If relevant, the paragraph of the Section 508 standards appears there too.
So using this interface, if you want all WCAG priority 1 and 2 sure fire tests (no warnings), restrict the Type column to Errors and the WCAG Priority column to 1 and 2, using the pull down menus shown in Figure 13-2. Then activate the Select All in View button—and each of the check boxes will get checked. Well that should work. It doesn’t. What happens as a result of the sequence just described is that all P1 and P2 tests are checked, including the warnings. You have to go back and sort through and uncheck the warnings you don’t want.
Analyze the files – Bobby
The Project Properties dialog also contains the place where you set up Bobby to analyze the site. The screenshot in Figure 13-3 shows the What to Scan portion of the Properties dialog.
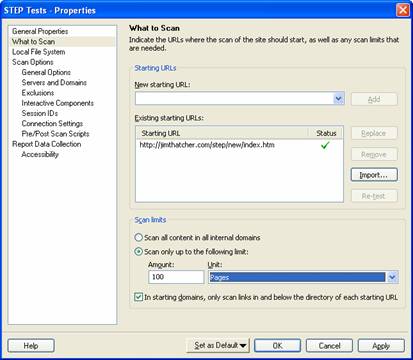
Figure 13-3. Specify files to scan for Bobby
The Scan Limits portion of this dialog is disappointing. Rather than a click depth, only the number of pages (or directories) is allowed to limit the scan. That’s not a problem for our test files, but for a site with more complicated structure, the numeric limit is (may be) very different from the click depth limit. It would seem that if the process of analysis is multi-threaded, even successive runs might find end up with different sets of files. And depending on the algorithm for finding the 100 files, the selected files might all be down one branch of the site’s tree, as opposed to sampling broadly across all branches (which is what click depth constraints do).
Click the OK button and back on the main interface use the menu to Scan the entire site ( Scan | Scan Entire Site ) or click on the green arrow to the right of the URL entry field at the top of the window.
Examine the results – Bobby
Like Ramp, WebKing and InFocus, the left hand pane of the user interface contains a list of files. When any file is selected, the report is displayed on the right. Other options on the right pane of the user interface include the raw HTML of the page, a preview of the page and a list of pages associated with the current highlighted item.
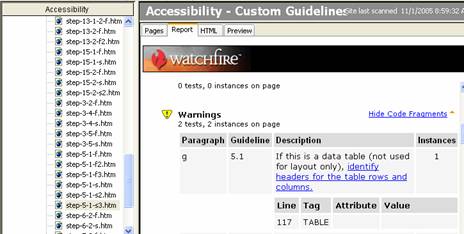
Figure 13-4. Examining the results with Bobby 5.0
That report has a lot of unnecessary formatting (Watchfire logo and widely spaced tables) that actually serves to hide the important information. With patience one can step through each of the files and determine whether or not Bobby 5.0 passes the various issue tests.
Report formats – Bobby
Report formats in Bobby 5.0 are disappointing. There is no way to view the results of the Bobby 5.0 analysis except by viewing reports in the Bobby user interface. There is no way to save the report or share it with someone.
Well, almost no way! It is possible to obtain an XML report, but first you must edit the Windows registry, HKEY_LOCAL_MACHINE\SOFTWARE\Watchfire\WebXM\2.0\WFScan, adding a string value with name BobbyLog and value which is the path and filename for the XML outbut file. I
used C:\bobby.xml for simplicity. Be sure to copy that file to some other place (or to some other
name) because the next time you run Bobby 5 the XML file will be overwitten. Before editing the Windows registry like
this it is recommended that a backup be prepared, see http://support.microsoft.com/kb/322756.
InFocus from SSB Technologies
I used InFocus Version 4.2.2 (http://ssbtechnologies.com, $1795 for corporate customers) for these tests.
InFocus did not release a new version of the product between the first and second runs of the tests. SSB has an enterprise
product and I was told that the analysis engine is the same for the two tools.
Set the tests to be used – InFocus
After starting InFocus open the Testing Control dialog ( Configuration | Testing Control).
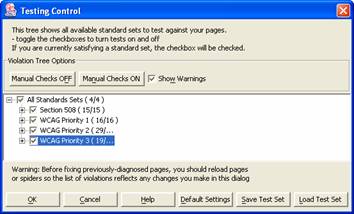
Figure 13-5. InFocus choosing tests
The testing control dialog offers a welcome option: Manual Checks OFF (see Figure 13-5). After reading the caution to not use color alone to convey information on every page for 100 pages one gets very tired of the advice. It is important not to use color alone to convey information but we are smart enough (I hope) to not have to be reminded of that fact at every turn—well on every page. So it is with all the manual checks and InFocus is the only tool to provide a single option to turn all those tests off.
The simplest way to get all Section 508 and WCAG P1P2 (non-manual) tests is to make sure all tests are checked. Then uncheck WCAG Priority 3, and select “Manual Checks Off.”
There is a check box in the row above the standards tree view with the prompt Show Warnings . This has nothing to do with the tests themselves and that is confusing at first. These are warnings that appear as you turn on or off selected tests.
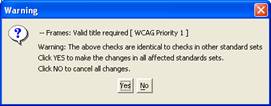
Figure 13-6. A warning about rules shared between 508 and WCAG
So for example, if you turn off the check for frame titles in Section 508, you are “Warned” (see Figure 13-6) that this is also turning off the frame test in WCAG. You can decide you don’t want to be bothered by those warnings by un-checking the Show Warnings checkbox. This decision is superior to the one found in, for example, the LIFT machine, where it is necessary for you to manually turn off all occurrences of any given test.
This is only the beginning of tailoring your test procedure with InFocus. Many of the tests take “parameters” like the test for valid alt text excludes alt text that is too long or contains certain words. These options are set in InFocus Test Settings dialog (Configuration | Test Settings) as shown in Figure 13-7.
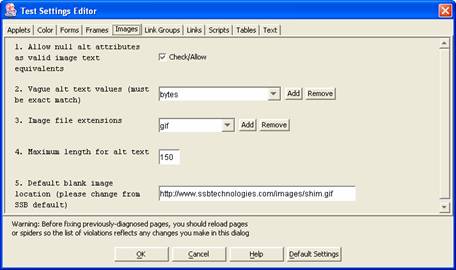
Figure 13-7. Test settings for InFocus
Many of the tests depend on settings like these. One of the most interesting pages in this dialog is the one that determines
which <table> elements will be considered to be data tables.
Analyze the files – InFocus
After choosing the tests to be used, we want to setup to analyze the test files. If you want to check a single file, just enter it in the URL field at the top of the main window, and press enter. But we need to spider to depth one for the test files.
Click on the “Spider” icon or in the menu choose ( Edit | Create Spider). There are seven steps.
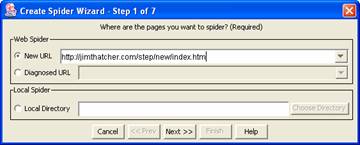
Figure 13-8. Setting up the spider in InFocus
Enter the URL in the first step as shown in Figure 13-8. Step 2 asks for authentication and we have none. The third step is important. As show in Figure 13-9, this is where you choose the report format and report location. The options for report format are XML, EARL, XLS (Excel Spread Sheet), or HTML.
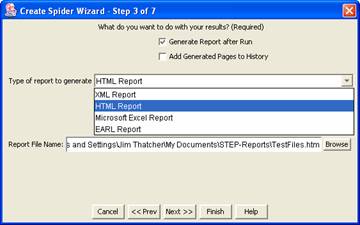
Figure 13-9. Choosing report options with InFocus
In this dialog, be sure to check “Add Generated Pages to History” which is not checked by default. With this setting you can check out the errors using the InFocus interface which for our purposes is much easier than the using one of the reports.
The fourth step show in Figure 13-10 determines the number of files to be analyzed. It is recommended with InFocus to keep this number relatively small, less than 100. If you want to scan more than that you probably need to consider SSB Technology’s Enterprise product.
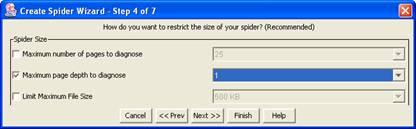
Figure 13-10. Choosing the extent of the scan with InFocus
InFocus refers to “page depth” for what I think of as “click depth”—the number of mouse clicks or links followed from the start page in Step 1 to the analyzed page. You can also specify the maximum number of pages and the maximum page size.
In Step 5, you filter file types to diagnose. Step 6 is another modification of the search conditions, whether the followed URL’s have to be in the same folder or of the same host. We choose the same host. Finally in Step 7 you choose the speed of the spider, I always leave that at the default setting. Then select “Finish” to be placed on a screen where the progress of the scan is displayed after you select and activate “Start.”
Examining the results – InFocus
It is especially easy to run through the test file results with the InFocus user interface. Most issues require looking at two files, the good one and the bad one, so to speak. As shown in Figure 13-11, you can highlight the two files in the tree view on the left and open up the tree to list the errors detected.
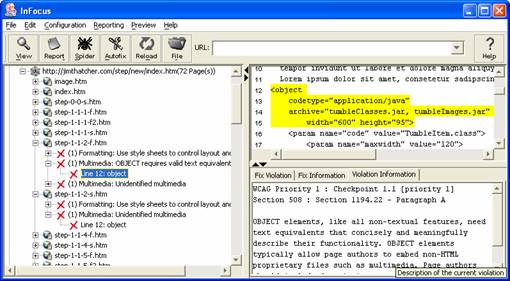
Figure 13-11. The InFocus user interface for examining errors
The issue being examined in the screenshot in Figure 13-11 is #3 Object requires default content. The
two files are step-1-1-2-f.htm (the failing file – with an error) and step-1-1-2-s.htm (the
successful file—no error). In the screenshot above, the tree is opened at those two files, the one that should fail (no
default content) does indeed invoke an error, OBJECT requires valid text equivalent while the file in which that alternative content is provided
does not have that error. In this way, one can go down each of the issues, check the corresponding files and determine
how InFocus fares on the tests. It is much easier to make these comparisons here with the InFocus user interface than in
the various reports that are available.
Report formats – InFocus
If, during step three of the spider definition (Figure 13-9), you specified a report type and location, then the InFocus report will be there when the analysis completes. You can create additional reports by going to the main menu and choosing Reporting | Generate Reports. The Generate Report dialog allows you to select individual files or spidered directories as the subject of the report.
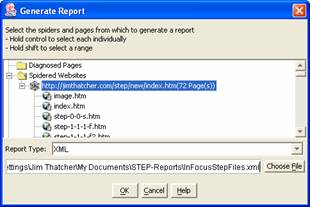
Figure 13-12. Report selection with InFocus
The options for Report Type are HTML, XML, Microsoft Excel or EARL. As such, InFocus is the only tool to include EARL as a report format option.
The LIFT Machine by UsableNet
The LIFT machine ( http://usablenet.com, LIFT Online, $999) is a server based testing tool from UsableNet. The way it works is that you log on to the LIFT machine server to set up scans of desired web sites. You can be notified by email when a job finishes or you can just wait. Depending on the size of the scan, it doesn’t take very long.
On the first pass over the test files LIFT had the highest score with 26 out of a possible 36 or 72%. I have modified the tests and the definition of some of the issues so the scores have changed but at the time of the first run the LIFT score was the best.
The LIFT machine has a wide range of configurability which I consider to be very valuable. But there were a number of issues in that configuration process that were distracting.
Choose the tests to be used – LIFT
There are many choices for sets of tests with the LIFT machine. The main window has a set of tabs as shown in Figure 13-13.
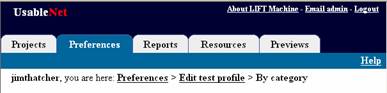
Figure 13-13. The tabs for the LIFT machine user interface
Choose the Preferences tab. On the preferences page there are four groups of settings, the Test profiles, Spider profiles, User interface settings, and Account settings . We are interested in the test profiles. Expand that section and select Duplicate for the profile entitled, W3C/WCAG 1.0 priority 1 & 2 . Since that test profile is shared amongst users of the LIFT machine, you can’t edit it directly. Instead you can make a copy (duplicate), give the copy a name and then edit the copy. The name selection is straightforward, then Save that copy. The LIFT machine then opens screen to edit the copy you have created as shown in Figure 13-14.
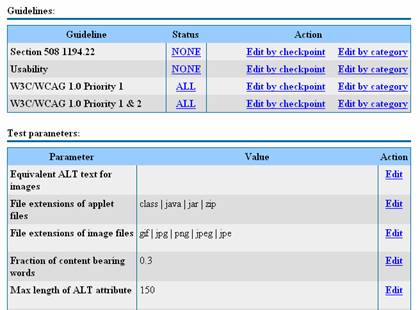
Figure 13-14. LIFT Choices in editing a test profile
Note from the screenshot in Figure 13-14, all of the WCAG priority 1 and 2 tests are included, and none of the Usability or Section 508 1194.22 tests. If we were to employ all of the 508 tests now (just click on NONE, and it will change to ALL) many tests will be duplicated. As an alternative, select Edit by Checkpoint on the Section 508 line, and change NONE to ALL on both 508 (n) Forms and on 508 (o) Skip Menus . Then return to Edit Test Profile, with the Link at the top of the page as is shown in Figure 13-13.
This process created a new test profile which we can now use in the analysis of the STEP files.
Analyze the files – LIFT
To analyze the files as with the other tools you should set up a project. Use the Projects tab of the main window (see Figure 13-13) and select New Project . The choices are quite simple. But Caution, if you decide to edit the spider profile, for example, then when you come back to the project screen, some of your choices will have disappeared. The project dialog is shown in Figure 13-15.
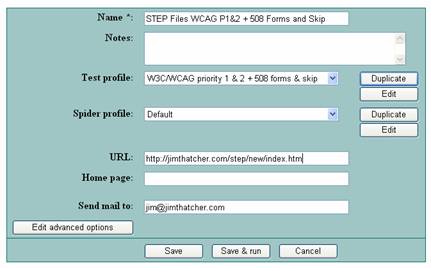
Figure 13-15. The choices for a LIFT project
Be sure to pick a name that will distinguish it from other projects because only the name appears elsewhere in the process.
Choose the test profile WCAG priority 1 & 2 = 508 forms and skip which was created in the step above. The default spidering profile us unlimited in click depth but limited to 250 files. That will easily cover the test files. Don’t forget to add the starting URL ( https://jimthatcher.com/step/new/index.htm ). This could be part of the spider profile, or not, as you wish. Since we are using the default, we must add the URL here.
When the parameters are set, choose Save and Run . This submits the job to the LIFT Machine. You will receive email when the job is done— or you can sit on the project page and wait—hitting refresh (F5) occasionally. For large projects I would not advise that process.
In my case, the progress indicator specifying the total number of pages completed got stuck at 23 pages (a minor bug) so that the progress read, 45 of 22 pages, 55 of 23 pages, 67 of 23 pages, and then finally completed 70 pages. Figure 13-16 shows the final status report. It took less than 2 minutes.
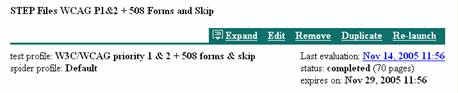
Figure 13-16. The item on the projects page for the completed project
Examine the results – LIFT
Now let’s find the results of this evaluation. The date of the last evaluation, Nov 14, 2005 11:56, as shown in Figure 13-16 is a link; follow that link to display a summary of the overall status, indicating how many pages had errors and how many did not. Our test pages did not fare well. This summary page indicated that there was only one page with no errors; in fact it wasn’t even a page, there were no errors on something called SITE LEVEL ISSUES which I haven’t figured out yet.
From the summary page, there is a link, view failed pages, and that is what you want. Then from the list of failed pages we can examine the individual reports for each of the files to determine whether or not the tool passed each test. A sample individual report for the file step-0-0-0.htm is shown as a screenshot in Figure 13-17.
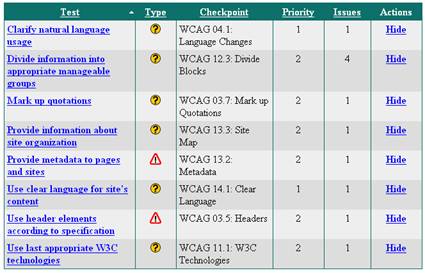
Figure 13-17. LIFT sample report for a single page
The subject file has no errors, several manual checks and two warnings, a total of 8 warnings and manual checks. A neat feature in looking at the reports here—rather than downloading them—is that while looking, you can decide to hide issues and they won’t appear when you look at subsequent pages. If you made a mistake in setting up the tests, you may get duplicate rules, one coming from Section 508 and one from WCAG. It seems to me that there should be one rule which belongs to both the 508 set and the WCAG set, but if you end up with such duplicate rules, you can hide them here and they will not appear on subsequent pages.
Report formats – LIFT
Move to the Reports section of the LIFT Machine user interface with the Reports tab (see Figure 13-13). Then use the link, New Report, just under the tabs. There are several options, both in format and in detail as shown in Figure 13-18.
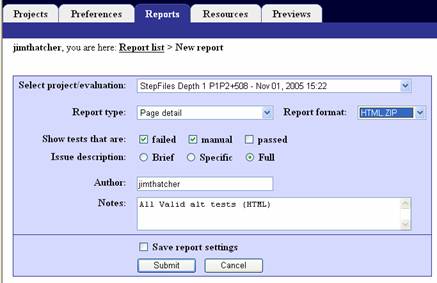
Figure 13-18. Choosing report details in LIFT
The report type can be either detailed or an executive summary. The format can be HTML or XML. Other choices include whether or not to include manual checks, passed tests, and whether the issue descriptions should be brief, specific, or full.
After submitting the request, the LIFT machine creates the report. It usually takes a couple of minutes and, like the
scan, you can wait for an email notification or just refresh the page after a minute or two. The format is a single zip
file, called getreport.zip as a default. When the report has been prepared the report name (project name
plus date) becomes a link (similar to the situation when the scan was finished, Figure 13-16) which you can activate to
download getreport.zip . I suggest changing the name at this point (in the Save-as dialog) so that you don’t
risk overwriting a different report from the LIFT machine.
Ramp Ascend from Deque Systems, Inc
Ramp Ascend (http://deque.com, $1499) is an accessibility testing and remediation tool from Deque Systems
Inc. I first tested with Ramp 4.0 and reported my results to Deque Systems. The next version of their testing tool, Ramp
Ascend 5.0, improved over their previous version by 7 points or 25%. Ramp Ascend Version 6 is due out in early 2006 and
with a beta copy of that version their score was improved another 7 points to have the best score of 38 out of a
possible 40. Their response to the challenges of the tests and to comments about their UI was absolutely outstanding. Ramp
is also available without the repair function, called Ramp Grade for $279, which would have worked just as well for our
tests, and then without spidering, RampPE (Personal Edition) for $79. Deque also has an enterprise version, called Worldspace.
All versions use the same analysis algorithms.
Choose the tests to be used – Ramp
After opening Ramp Ascend, open the Accessibility Options dialog ( Tools | Accessibility Options ) and there choose the Analysis tab. This dialog is shown in Figure 13-19.
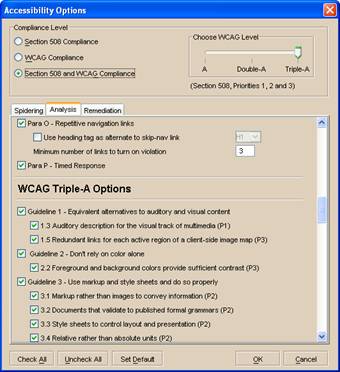
Figure 13-19. Choosing the tests in Ramp 6.0
In Ramr 4.0 you could only choose Section 508, or Web Content Accessibility Guidelines Priority 1, Priority 1 and 2 or Priority 1, 2 and 3. Like Bobby, the compliance selections were alternatives (radio buttons), either Section 508 or WCAG but not both. In order to get the 508 tests and the WCAG Double A tests it was necessary to make two runs. That is changed in version 6.0 as indicated in Figure 13-19.
Another disappointing aspect of this Ramp 4.0 was the fact that the WCAG compliance level was not accurately represented in the detailed list of checkpoints/tests. But that too has changed in Ramp 6.0 as can be seen in the dialog shown in Figure 13-19.
To eliminate the “manual checks”, I went through and unchecked those items that I thought would only result in warnings, like “Clearest and simplest language,” Checkpoint 14.1. Another improvement that Ramp might make is to add an option like that which InFocus has, to eliminate manual tests..
Analyze the files – Ramp
Having chosen the tests, it is a simple matter to crawl the test files. All we need to do is enter the URL in the edit box at the top of the main user interface window, select 1 for the link level to the left of the URL field, and select Analyze as shown in Figure 13-20.
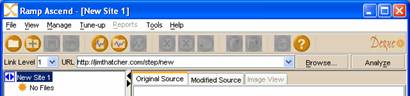
Figure 13-20. The Ramp specification of parameters for the analysis
You can also set up the analysis using the Analyze Web Application dialog ( File | Analyze Web Application ). There were no significant advantages going that route in what I wanted to do. However when set up that way, a web application can be re-spidered with no input required from the user because session and state values are stored in the Web application script and automatically used.
Examine the results – Ramp
The method of examining our test files is similar to what we found with InFocus. The user interface includes a list of files and each can be highlighted to expose the source code and a list of violations on the right panels of the user interface. There is one important addition shown in the screenshot in Figure 13-21.
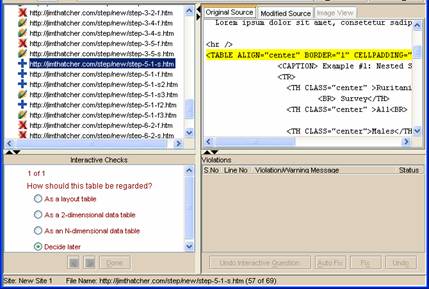
Figure 13-21. The Ramp interface for examining errors
The section “Interactive Checks” is at the bottom right of the user interface. The presence of these interactive checks for a given file is indicated by a plus icon in the file list. Errors are present in files marked with a red X and a clean bill of health is shown with a green check mark. With the interactive checks, the tool is asking for help to clarify the role of certain features of the page. All four files with Interactive Checks shown in the screenshot are files with data tables and the check is to confirm (or deny) that they are data tables—even to decide between a simple table (2-dimenstional table) and a complex data table (N-dimensional table).
My test case for data tables was specifically designed to see if the tools recognize data tables, or can distinguish
data tables from layout tables, at least in what I would call “obvious” cases. Although Ramp is looking for confirmation,
the tool has drawn the distinction I was looking for because the file with a layout table (step-5-1-s3 )
is not called out for an interactive check whereas the files with data tables require the interactive confirmation.
In other words, Ramp is raising the interactive check for tables in just those cases where the tables were, in fact, data
tables.
The down side to the interactive check idea is that you may have to interact too often. If you chose all the Priority 1 WCAG tests then you will get the interactive check, “Are there foreign words/phrases used in this document” on everyfile. That user check seems to be the first, so you have to answer it before others in the queue. You may quickly realize that it is best to uncheck that test in the Accessibility Options dialog. On the other hand, that seems to be the only interactive check elicited on every file. These interactive checks provide valuable addition to the process with some costs in user involvement. According to Deque, there enterprise product streamlines this process significantly.
The process of examining the files is simple; the errors are displayed on the right as is the source code as shown in Figure 13-22.
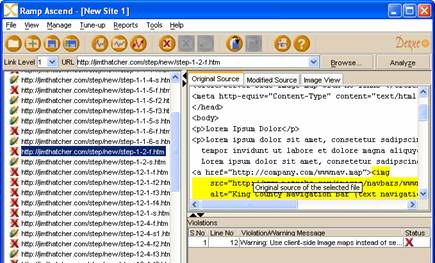
Figure 13-22. Examining the results with Ramp
Report formats – Ramp
The reports are available in XML and HTML formats. For the XML report use Reports | Generate XML Report from the main menu. Be sure that the site is highlighted (selected), not one of the files. Each report opens in a Ramp window but you can view it in the browser ( Report | View in Browser ) or save as HTML.
All the HTML reports are in fact derived from the XML output. They range in detail from a Site Synopsis to a listing of all violations together with code ( Reports | Violations Code All Files ). In fact Ramp includes a “Report Wizard ( Reports | Report Wizard ) where you can choose which tests you want included.
WebKing from Parasoft, Inc.
WebKing ( http://www.parasoft.com) Version 5.1 is from Parasoft, Inc. This product is much more complex and powerful than any of the other tools that we have talked about so far. Testing for accessibility is only a very small part of its function. As with the other products you can modify which tests are to be used, but with WebKing—if you don’t like the rules that Parasoft provides—you can write your own or modify the ones that they provide and the results are available across several platforms.
Choosing the tests to be applied – WebKing
The basic choice for existing rules is found with the menu selection Tools | Customize . Then on the left side to the Customize dialog, select Check Web Accessibility .
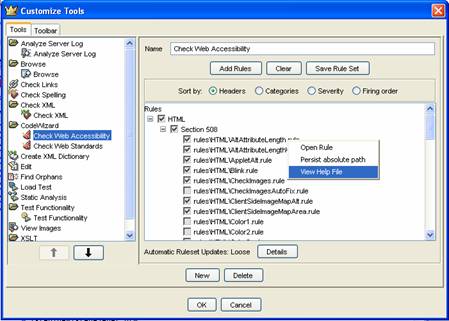
Figure 13-23. Choose tests with WebKing
As shown in Figure 13-23, the rules tree has two nodes under HTML and these are Section 508 and WAI Guidelines. Under
each of those two is a list of check boxes for rules to be included or not. The text for each rule is actually the filename
of the rule, like rules\HTML\Blink.rule . If you right click on any rule the context menu (see Figure 13-23)
includes options to open the rule (note, it opens in the main window behind the customize dialog) or to view the help file
which describes the function of the rule. Rules can be sorted by Headers information
(508 and WAI), by Categories (accessibility, navigation, presentation), by Severity or
by the order that the rules are applied by WebKing ( Firing Order ).
The sorting by Section 508 (as partially shown in Figure 13-23) and by the WAI Guidelines is misleading because rules are only listed once. The rules listed under “Section 508” are not repeated under WAI Guidelines. The rules that appear under WAI Guidelines are only the ones that support WCAG Checkpoints that are not found in Section 508. For example, the CheckImages.rule rule listed under Section 508 (Figure 13-23) is the one that checks for alt-text and thus implements WAI Checkpoint 1.1 but it appears in the Section 508 list, not in the WAI list.
Analyze the files – WebKing
To begin testing for accessibility you need to establish a project. To start, use File | New Project and select the Project tab to give a name to the project. Then use the Source tab to specify the parameters of the scan as shown in Figure 13-24.
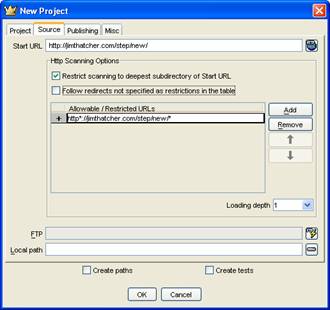
Figure 13-24. WebKing dialog to specify a project
Enter the URL in the Start URL field (we used https://jimthatcher.com/step/new/index.htm ). The loading depth (click depth) defaults to 1; that is what we want for the test files. Select OK and then WebKing will load the site with user intervention for entering data in form controls. The first time I was given that opportunity, I chose skip all for the forms which meant that further user intervention was not rquired. Note that this process does not perform any analysis on the files; it only does the specified spidering and loads the files.
Once the project files are loaded, they are represented in the project tree on the left side of the user interface. From this project tree you can perform analysis and transformation operations on files or, more generally, on sub-trees of the project tree.
Highlight the root of the project tree, then select Tools | Code Wizard | Check Accessibility . This will evaluate WebKing accessibility rules against all the files in the tree and produce the results displayed on the right panel of the user interface as shown in Figure 13-25.
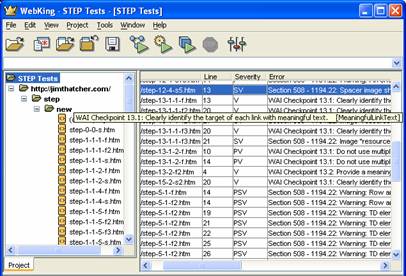
Figure 13-25. Results of the WebKing Check Accessibility tool
Examine the results – WebKing
The results window (see Figure 13-25) lists all the errors (and warnings). So for our process we just check if an error has been raised when it should be raised, and when necessary check that no error has found for the comparison files.
When I first ran these tests, WebKing had the lowest score at 18. Now theirs is the highest at 34; that is almost doubling the performance.
Report formats – WebKing
Make sure that the Check Web Accessibility results are in the right hand pane of the WebKing window. If you have changed the contents of that pane, you can return to the accessibility results using the Windows dialog (Window | Windows) and select Check Web Accessibility and then Show . The reports are not available from the main menu. Instead you need to bring up the context menu (Figure 13-26), right click on the report window, select save, and choose between HTML, text, XML, binary, or CSV.
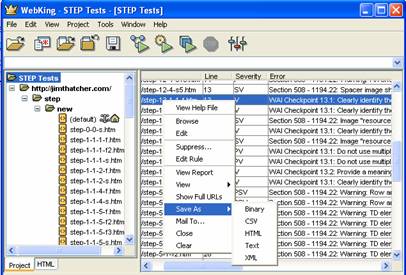
Figure 13-26. Choosing a report format
The report is saved as a single file with the same contents as appears in Check Web Accessibility panel (right-hand side) of the interface.
WebXM form Watchfire
WebXM ( http://watchfire.com ) from Watchfire is a server-based tool like the LIFT machine. It is very sophisticated with many functions as indicated by this quote from the WatchFire site:
WebXM is the only Online Risk Management platform to automate the scanning, analysis and reporting of online security, privacy, quality, accessibility and compliance issues across corporate web properties. WebXM ensures visibility and control by delivering executive dashboards that are used to identify, assign and track the issues impacting your online business.
There is much more to WebXM than accessibility, in fact accessibility was only added in 2003 after Watchfire acquired Bobby.
Set the tests to be used – WebXM
Because of the complexity of the tool, we are not going into detail with the process of setting up the tests and scanning the site but give a suggestion instead. The project concept for WebXM is a “webspace” in which the user sets many defaults for “scan jobs” in that webspace. The screenshot in Figure 13-27 shows the dialog for picking the accessibility tests.
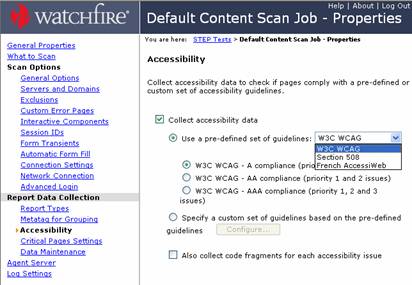
Figure 13-27. Setting default job properties
The Accessibility dialog is one of many that can be opened from the menu on left that is shown in Figure 13-27. The process for choosing tests is hauntingly similar to that for Bobby 5.0. There are three guideline sets to choose from, W3C WCAG (A, AA, or AAA conformance), Section 508 and French AccessiWeb (Bronze, Silver or Gold conformance). The custom set is always a possibility, and when that is chosen the list of all tests is presented and the user can choose which tests to use.
The dialog for choosing the custom set of guidelines is shown in Figure 13-28.
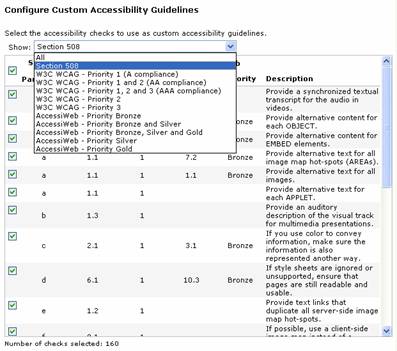
Figure 13-28. Setting up testing control in WebXM
I am not certain what technique is the best for choosing tests in this dialog. I wanted to use the 508 tests plus WCAG Priority 1 and Priority 2 tests. Then I wanted to go through those to eliminate any tests that would just clutter the reports. The way I did that was to first select All in the combo box and uncheck everything. Then select Section 508 and check those and W3C WCAG – Priority 1 and 2 (AA Compliance) and check those. This choice however leaves many of the interesting Accessiweb tests ( http://accessiweb.org ) unchecked.
Setting up to analyze the files – WebXM
The What to Scan option is in the collection of navigation links on the left of the Job Properties dialog as shown in Figure 13-27. In the What to Scan dialog one just enters the start URL and the usual options about what to scan. Like WebKing and Bobby 5.0, you cannot specify a (click) depth for the scan but you can limit the scan by number of pages. The Watchfire technical contact explained this as follows:
Since WebXM is optimized for enterprise scanning, a given scan job is usually performed by multiple “scan agents” that can even be installed on different servers. Those scan agents operate completely independently. Whenever one finds a URL in a link, they check the database and if it hasn't already been stored, adds it to the queue for later scanning. When an agent finishes scanning a page, it pops whatever URL happens to be on the top of the list and scans that, even though a different agent may have put that URL on the list.
But he also explained that there is considerable interest in the option of limiting the scan by click depth and that it may be available in the in a later version of the product.
The process so far established default job settings and options. In the webspace, one now creates a job ( Create Scan Job from the menu on the left) which inherits all the default settings established so far. Use Create and Continue link at the bottom of the page. Next move to the Reports link on the left of the create job page (very similar to Figure 13-27) and there use the Create and Package All button; then Finish. When that is done a link is available to Run the job. After running the job, reports will be available in the Report Pack area of the webspace.
Examining the results – WebXM
Select the Report Packs tab in the workspace. There the report will be listed as a link, open it. The report interface has a menu down the left like that for job properties seen in Figure 13-27. This time, the menu provides various ways to view the report. The screenshot in Figure 13-29 shows the menu with Pages with Section 508 Issues selected.
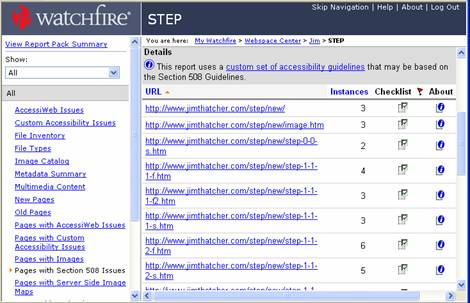
Figure 13-29. The list of files with errors in WebXM
Since I want to study each file I have sorted the list of files by URL, done by clicking URL at the top
of the list. Each file can then be analyzed by looking at its report; a sample of this is shown in Figure 13-30.
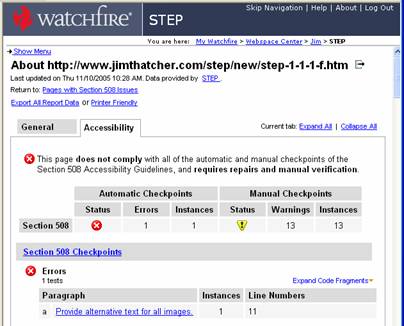
Figure 13-30. WebXM report format
That report format shown in Figure 13-30 is reminiscent of the report format in Bobby 5.0 (Figure 13-4). It is necessary to scroll down the report to find the errors and warnings of interest.
Report formats (WebXM)
When any report is opened there is a link Export all Report Data near the top of the page. That link will
download the data of the current view as an xml file. Alternatively, the Printer Friendly link
opens the current data as an HTML file in your web browser, at which time you can save as wanted. The views include the
summary for each of the options shown in the left menu of Figure 13-29, and the individual reports for specific files.
I was not able to find a way of downloading a report that had both, the list of files for a set of issues, and the specific
errors found with each file. I am sure it exists.